Readiness signals in 10,777 currently content-qualified destinations
Published October 5, 2026. Observations and review dates are distinguished below.
Executive finding
The complete review of 11,413 historical destinations established 10,777 unique current content-qualified destinations. The requested 10,000 threshold is met under this definition, and collection remains stopped. The remaining accounting is 105 excluded inputs, 530 inconclusive inputs and one additional current eligible duplicate. Original observations are preserved.
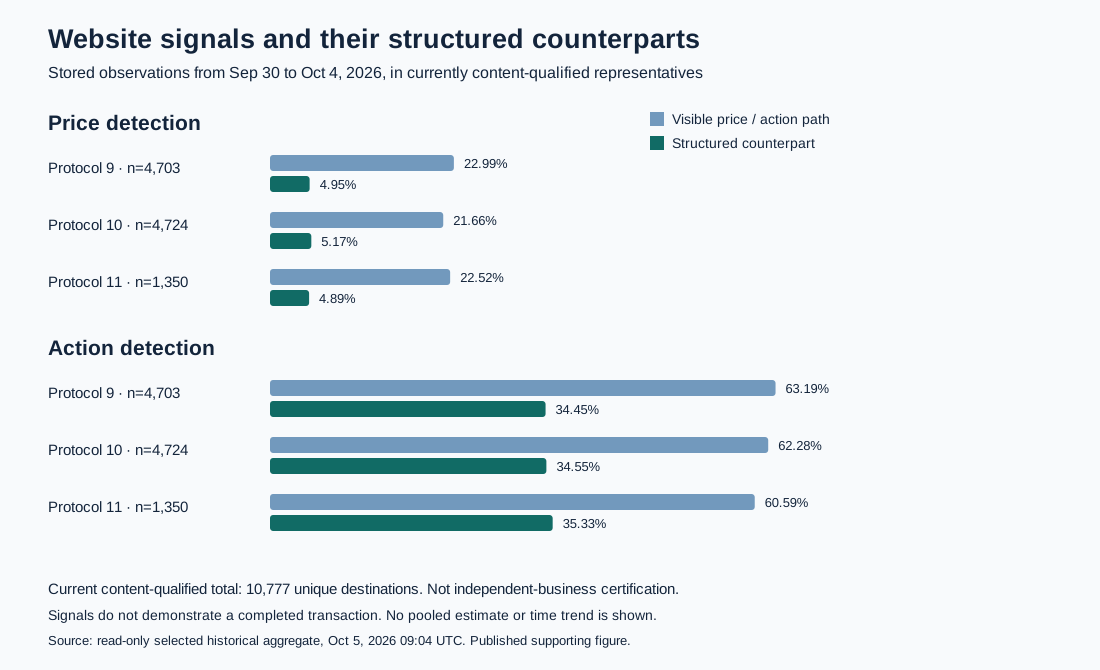
The clearest descriptive finding is the gap between ordinary website signals and structured commercial signals. Across the three separately reported historical cohorts, visible-price detection was 21.66% to 22.99%, compared with 4.89% to 5.17% for structured price. Action-path detection was 60.59% to 63.19%, compared with 34.45% to 35.33% for structured action.
Those ranges summarize the separately reported cohorts. They are not pooled population estimates, a time trend or proof of whether an AI agent can transact.
Reviewed denominator
| Cohort | Historical inputs reviewed | Current qualified representatives | Historical observation window |
|---|---|---|---|
| Protocol 9 | 5,000 | 4,703 | September 30 to October 1 |
| Protocol 10 | 4,990 | 4,724 | October 1 to October 3 |
| Protocol 11 | 1,423 | 1,350 | October 4 |
| Total current unique | 11,413 | 10,777 | 2026 |
Review occurred October 5. All inputs received a disposition; unresolved access or semantics are reported as inconclusive. The automatic screen, flag adjudication and current-domain deduplication are consistent across this review set. Historical collection eligibility was not consistent, so historical scores and signals remain separated by cohort.
Historical readiness signals in the reviewed subset
| Stored signal | Protocol 9, n = 4,703 | Protocol 10, n = 4,724 | Protocol 11, n = 1,350 |
|---|---|---|---|
| Visible price | 1,081 (22.99%) | 1,023 (21.66%) | 304 (22.52%) |
| Structured price | 233 (4.95%) | 244 (5.17%) | 66 (4.89%) |
| Action path | 2,972 (63.19%) | 2,942 (62.28%) | 818 (60.59%) |
| Structured action | 1,620 (34.45%) | 1,632 (34.55%) | 477 (35.33%) |
| Visible availability | 3,338 (70.98%) | 3,275 (69.33%) | 914 (67.70%) |
| Structured availability | 1,080 (22.96%) | 1,119 (23.69%) | 329 (24.37%) |
| JSON-LD present | 3,241 (68.91%) | 3,258 (68.97%) | 937 (69.41%) |
| Parseable JSON-LD | 3,231 (68.70%) | 3,242 (68.63%) | 935 (69.26%) |
| Offer schema | 339 (7.21%) | 346 (7.32%) | 105 (7.78%) |
| Offer details | 210 (4.47%) | 205 (4.34%) | 64 (4.74%) |
| Business identity signal | 2,215 (47.10%) | 2,230 (47.21%) | 624 (46.22%) |
| Contact signal | 3,816 (81.14%) | 3,830 (81.08%) | 1,081 (80.07%) |
| Policy signal | 435 (9.25%) | 427 (9.04%) | 102 (7.56%) |
| Freshness signal | 1,673 (35.57%) | 1,694 (35.86%) | 477 (35.33%) |
| llms.txt format | 1,508 (32.06%) | 1,424 (30.14%) | 398 (29.48%) |
| Root agent.json shape | 0 (0.00%) | 0 (0.00%) | 0 (0.00%) |
| Well-known agent.json shape | 0 (0.00%) | 0 (0.00%) | 0 (0.00%) |
| Well-known agent card shape | 0 (0.00%) | 0 (0.00%) | 0 (0.00%) |
| MCP JSON shape | 3 (0.06%) | 0 (0.00%) | 0 (0.00%) |
| OpenAPI JSON shape | 1 (0.02%) | 2 (0.04%) | 0 (0.00%) |
| Score summary | Protocol 9 | Protocol 10 | Protocol 11 |
|---|---|---|---|
| Mean stored score | 52.44 | 52.25 | 52.19 |
| Median stored score | 52 | 52 | 51 |
These are stored scorer-version-2 outputs linked to the final current-qualified representatives, not new scores from the content review. A current redirect or changed homepage can make historical signals stale. The score is a scanner index, not the probability of a successful agent transaction.
Interpretation
Prices are much less commonly structured than visibly detectable
About one in five selected historical observations contained a visible-price signal, while about one in twenty met the scanner's structured-price test. This supports a narrow statement about the detected formats. It does not show why information is absent or whether a customer could obtain a quote elsewhere.
Action links are more common than structured action descriptions
Roughly three in five had a detected action path, while roughly one in three had a structured-action signal. Neither check completed a transaction. An action link may lead to a third-party booking system, a form or an unavailable workflow.
JSON-LD presence is not a substitute for commercial detail
Parseable JSON-LD appeared in 68.63% to 69.26% of these cohort subsets. Structured-price detection remained around 5%. JSON-LD can describe a website or organization without a priced offer. The tests do not establish schema accuracy, completeness or usefulness.
Discovery-file presence is a format observation
The llms.txt format check passed for 29.48% to 32.06% in the selected historical cohorts. These checks did not establish useful content or actual AI consumption. No agent-file or agent-card shape was detected at the exact probed paths. Three MCP-shape hits occurred in protocol 9; OpenAPI-shape hits were one in protocol 9 and two in protocol 10. The hit sets may overlap and were not union-counted. They are not verified callable endpoints.
Source labels cannot support sector claims
The review found examples inconsistent with Overture source labels. Labels remain unchanged and unverified, as approved. This report therefore does not rank restaurants, retail, healthcare or other sectors or claim that the sample comprises independently verified US businesses.
What was retained, excluded and unresolved
All 11,423 original rows remain intact, including ten historical repeated destinations. The full review used 11,413 representatives; 10,777 current unique destinations qualified. Excluded records and inconclusive records remain available for coverage accounting, not silently deleted. The one additional current duplicate is counted once.
The 530 inconclusive inputs include 460 access-related cases and 70 individually ambiguous cases. Inaccessible does not mean unqualified, and neither category receives a zero readiness score. No percentage of the general business population is inferred from these outcomes.
The separate protocol 12 pilot of 100 is not added to the reviewed total. Earlier failed quality gates remain documented; this current review does not retroactively certify those collection methods.
Relationship to the earlier 652-site study
This report follows the earlier study's distinction between ordinary web content and structured commercial signals. It does not compare percentages as a trend. The source frame, sample size, ordering, exclusions, eligibility rules and observation dates differ. Claims such as growth, improvement, decline or national prevalence would require a different design.
Supporting evidence
Aggregate figures, review counts, methodology and comparison chart.
Read-only aggregate verified October 5, 2026 at 09:04:11 UTC. Collection is stopped. Original records are retained privately; these public files contain only aggregate findings.